Quick Start
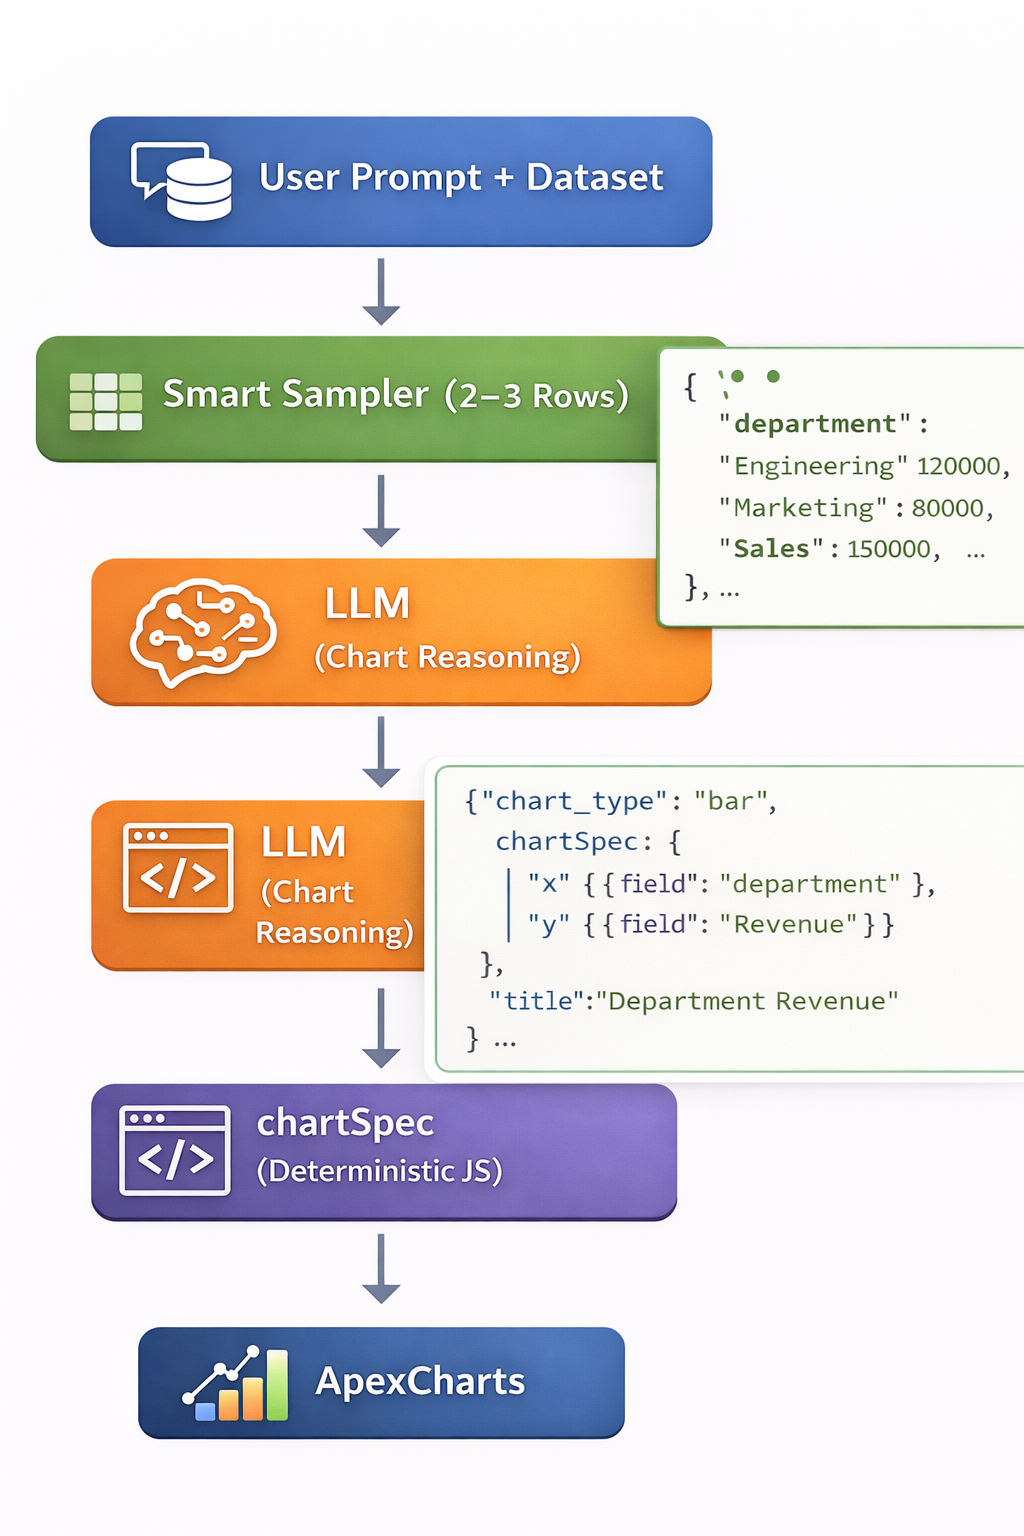
OpenVizAI turns natural-language chart intent into typed chart metadata, then renders production-ready charts from your full dataset.
In this guide, you will generate a chart config on your server with @openvizai/core and render it in React with @openvizai/react.
Prerequisites
- Node.js 20+
- A React app (Vite, Next.js, or similar)
- An LLM API key (OpenAI or Google Gemini)
- Dataset rows as
Record<string, unknown>[]
Install
npm install @openvizai/core @openvizai/react @openvizai/shared-types
Step 1: Generate Chart Metadata On The Server
Create a server function that calls analyzeChart with a prompt and dataset sample.
import { analyzeChart } from "@openvizai/core";

type Row = Record<string, unknown>;

export async function buildChartConfig(prompt: string, rows: Row[]) {
  const { result, sampleUsed } = await analyzeChart({
    prompt,
    data: rows,
    config: {
      provider: "google",
      apiKey: process.env.GEMINI_API_KEY,
      sampleRows: 50,
    },
  });

  return {
    chartType: result.chart.chart_type,
    chartSpec: result.chart.chartSpec,
    meta: result.meta,
    sampledRows: sampleUsed.length,
  };
}
Expected payload shape from your API:
{
  "chartType": "line",
  "chartSpec": {
    "x": [{ "field": "date", "label": "Date", "unit": null }],
    "y": [
      { "field": "revenue", "label": "Revenue", "unit": "USD", "type": "line" }
    ],
    "group": null,
    "category": null,
    "value": null,
    "source": null,
    "target": null,
    "start": null,
    "end": null,
    "series": null,
    "path": null,
    "is_stacked": false,
    "is_horizontal": false,
    "isSemanticColors": false,
    "colorSemantic": "neutral"
  },
  "meta": {
    "title": "Revenue Trend",
    "subtitle": "Monthly revenue over time",
    "query_explanation": "A line chart best represents change over time."
  },
  "sampledRows": 50
}
Step 2: Render In React
Pass the metadata from your server directly into OpenVizRenderer.
import { OpenVizRenderer } from "@openvizai/react";
import type { ChartLibrary, ChartType } from "@openvizai/shared-types";

type RendererProps = {
  rows: Record<string, unknown>[];
  chartType: "line" | "radar" | "bar" | "range_bar" | "pie" | "donut";
  chartLibrary: "apexcharts" | "chartjs";
  chartSpec: any;
  meta: {
    title: string;
    subtitle: string | null;
    query_explanation: string;
  };
};

export function RevenueChart({
  rows,
  chartLibrary,
  chartType,
  chartSpec,
  meta,
}: RendererProps) {
  return (
    <OpenVizRenderer
      data={rows}
      chartLibrary={chartLibrary}
      chartType={chartType}
      chartSpec={chartSpec}
      meta={meta}
      className="openviz-chart"
    />
  );
}
Expected Output
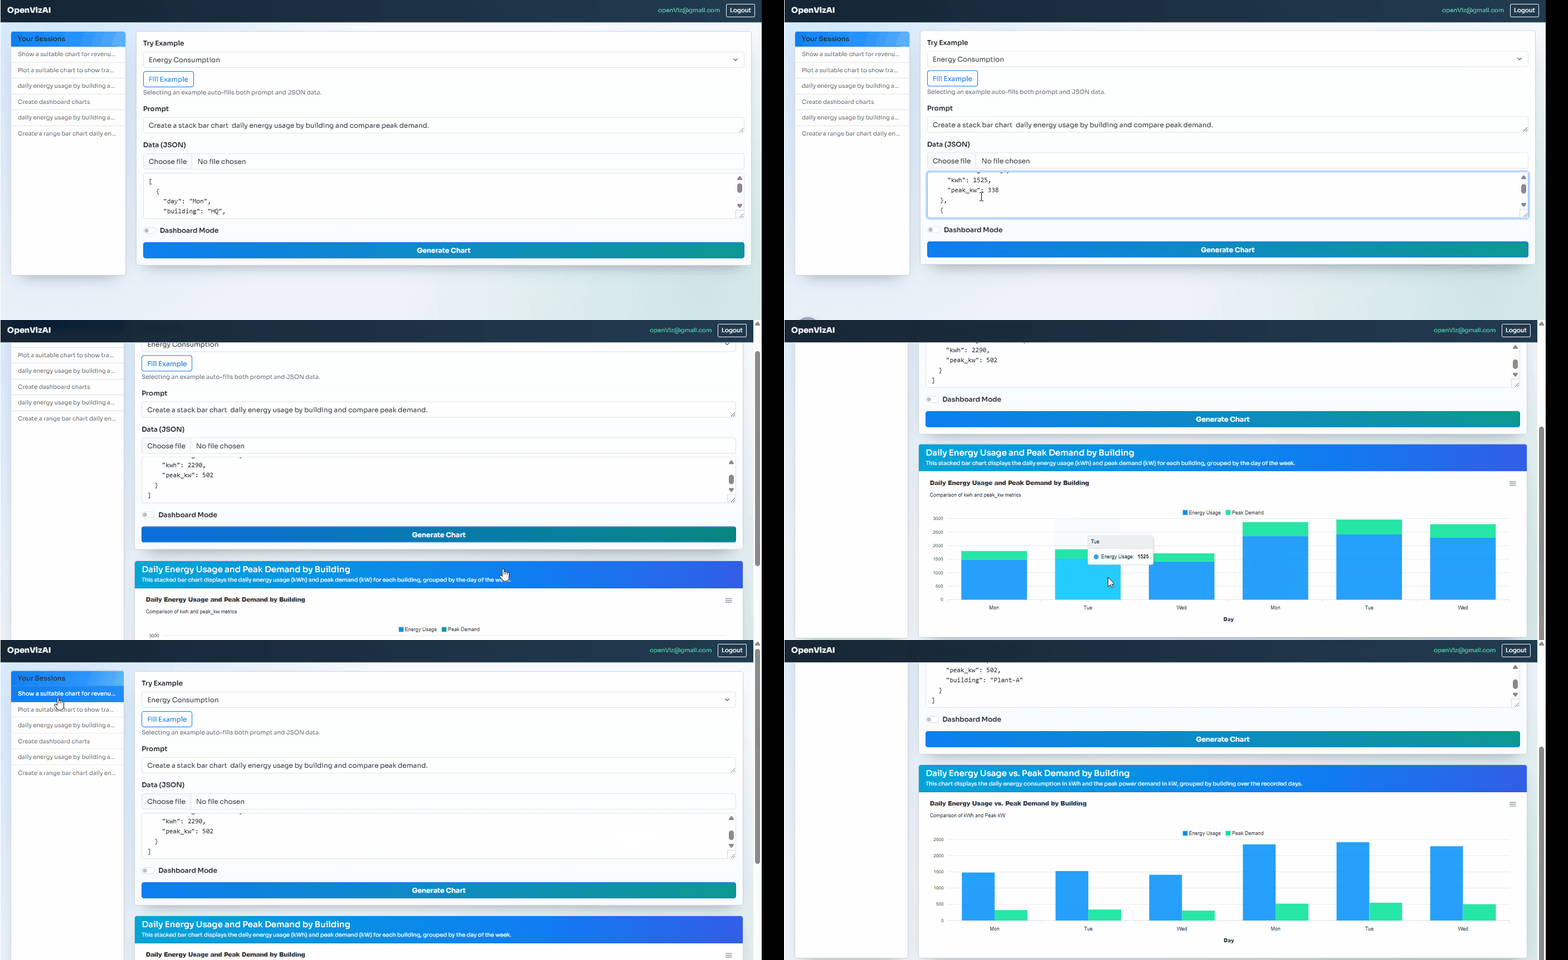
OpenVizAI keeps token usage stable by sending only sampled rows to the LLM while rendering with the full dataset.